Are MPs responsible for crime or the lack thereof in their constituencies?
Of course not. But we know they’re very interested in it and many people identify more closely with their constituency than their Police Neighbourhood. These are a sometimes arbitrary administrative division, the boundaries of which are yet to be released and have since December 2010 changed 200 times rendering all data in the older boundaries redundant !
We also realised that constituencies were a much better sample size for comparison with much more up to date population data for calculating crime rates. The Neighbourhood population data is from the 2001 census and has huge variation. Our constituency population data are estimates from mid-2009 and thanks to the Boundary Commission are as close as possible in voting size populations and not that different in overall population.
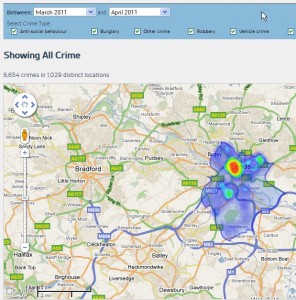
The next development here is that it quickly became apparent there were too many crimes in a given constituency to show them all with pins – up to 1000s per month. So we use crime heatmaps instead. Visitors to this blog are free to select the type of crime or ASB, the month or months and generate a crime heat map.
Anyway, here is an example jpeg for Leeds Central – constituency of Hilary Benn MP – see Leeds Central page here – we have 573 individual constituency crime pages for England and Wales.

